• Tag Archives GIS
  • Anything to do with Geographical Information Systems or mapping.

  • Race Day

    Well, we’re back from the half marathon in Hershey, and now back also from our nap…

    The race started at 7:30 AM, so we had to be there at say 6:30, so had to leave the house at 5:00, meaning we all had to get up by 4:30. We were all in bed by 9:00 last night, but it was still a hard morning. We got there about 6:45 — crazy parking traffic — and that was almost like “just in the nick of time” considering the bathroom lines, but Bruce & Heather lined up with no problems and the race went off without a hitch, then just as the race started we met up with Lorraine.

    We walked around to several different vantages together, managed to see all our runners (Heather & Bruce, and Adelle & Liz who did it as a relay), and I even got a few photos. The whole thing was over by about 10:00. After navigating back through the parking traffic mess, we all met up for brunch at a place in Hersey. Good to get some food and to catch up with everyone, but it had been a cold, windy day and the place was chilly inside; we were glad to get back in the car and crank the heat. We were home by 2:00.

    New Tools Bring New Opportunities

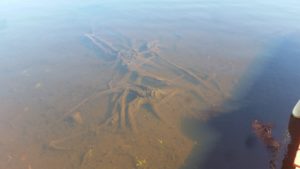
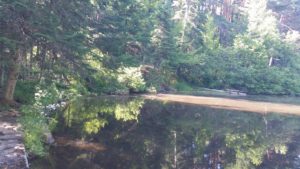
    One area on my routing map has been a bit problematic: Rt 329 out of Northampton goes past a reservoir, or old quarry or something, and the DEM elevation data dips pretty hard right next to the road, as well as under it at a bridge. Since I find total ascent and descent for each road using interpolated DEM data at points along them, the roads that go over, or even just near, big elevation changes can have large ascent/descent values even of they are relatively flat.

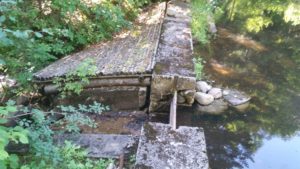
    The bridges have had an easy enough fix for a while: I simply make the ascent and descent (and adjusted ascent/descent) zero for each bridge, and I do the same for very short roads connecting to the bridge, like abutments. In other words, I fudge the data… (I figure the bridges are all fairly flat anyway except some longer, river-crossing ones, and since those are pretty far apart their actual ascent/descent values won’t affect the routing calculations much.)

    Fixing these roads near the quarry was a bit harder. I didn’t want to set ascent/descent values down to zero for the whole long and moderately hilly road, but now that I can update the ascent/descent data much more quickly — this was that “the task went from several hours to under a minute” process improvement from the other day — I was able to do my fudging on the elevation-at-road-points data: I made the elevations in the “dipped” spots the same as the points just outside, then re-updated my database with the new script. It worked great, the roads now route more realistically in that area, and it took about 5 minutes to do.


  • Milestone

    So I’ve been messing with that Lehigh Valley bike commuter routing program again, and I have made some important strides:

    • I found a way to update the recommend routes easy/advanced, etc, by maintaining separate tables of these routes as linestrings (which I can add and subtract, draw and redraw), then updating the relevant field in the main table using a spatial join. The update process is now automated simply by running SQL files, one for each type of route.
    • I sat down with the workflow for updating the main map table, and managed to automate much of it — everything but the SAGA tasks, though I think I can automate them too, eventually. I also managed to streamline one of the more time-consuming tasks: Generating the ascent/descent tables used to take upwards of 12 hours when I first did it (using Python within QGIS), and my next iteration (using PostGIS) took about 20 minutes, but my latest method got it down to about 57 seconds. Fifty-seven seconds! All of these are now also stored as SQL files or functions, so they are available almost at the push of a button. (My goal is a shell script putting all of this together.)

    These were both pretty big deals, since they were the only things keeping the project from being truly functional. Before this, keeping the database up-to-date was like pulling teeth. Unfortunately, I decided to add some front-end functionality, testing to see if selected points are within the Lehigh Valley, and that’s been a bit of a struggle, but if I can find a host for the project I think I can go live really soon.


  • Odds & Ends

    Posted on by Don

    I have a bunch more photos to put up about the final leg of our vacation (Ben’s graduation), but before I get to that I have a few other items, and a few other vacation photos, I want to post that really don’t go anywhere else.

    Vacation Miscellany

    Just a few photos of things around the cabin. Our place apparently was a camp once, having multiple primitive cabins, etc, and had been refurbished — and had the main house added — after years of downward fashionableness and possible abandonment; three cabins were still standing, one converted into a sort of detached den or game room, and the other two converted into separate sleeping quarters. Behind the cabins, as things were now arranged, was a small pond with a dam at one end. I’m not sure how important the pond had been in the past — it had the look of a kiddie fishing area — but now it was brown and scummy, and working its way back to being a meadow. (The lake was a lot better, but the muck at the bottom made for unpleasant swimming. Only Alex and I tried, and we only tried once.)  There were other camp amenities, including a fire pit which we made use of on the chilly nights.

    Shapes and Clusters

    The clustering experiments were a success, but what I really want is to show the regions or neighborhoods where my cycling amenities are clustered. I’ve been trying several different ways to build a shape around a group of points:

    • Convex Hull: this one is pretty nice, it’s the shape you’d get if a rubber band were stretched around the points. It’s also built into both QGIS and PostGIS. Unfortunately, if the point cluster has concavities the convex hull won’t show them — an L-shaped cluster would get a triangular region.
    • Concave Hull: this one is also available in both QGIS and PostGIS, but I don’t trust it — I can’t find too much about how it really works, its very name doesn’t make all that much sense, and it requires parameters that are not as well documented as I’d like.
    • Alpha Shape: the most promising of the bunch, defined pretty rigorously in “the literature,” and I like the l looks of the shapes it makes. Unfortunately, it doesn’t exist in either QGIS or PostGIS; it is available as a package in R, so I’ve spent some time this week getting R to run correctly after much neglect, then installing the “alphahull” package and trying it out. I managed to import my data and  create alpha shapes; now I have to find how to convert and export the shapes back into my database.

    There is one other method I just thought of, and pretty simple compared to these approaches: I could just make a heat map from the clustered amenities, then use a “contour line” function on the heat map raster. If the others don’t give satisfaction I may try this.

    Around Here

    Today was a brief respite from days of heavy, almost continuous rain — more is coming, starting tomorrow. I took the opportunity to attack the jungle that once was our back yard, managed to use up all the weed-whacker twine, and ran over a yellow jacket’s nest (no stings, but a fairly hasty retreat into the house for a while), and the yard looks much better if not quite 100% yet.

    We’ve also had a Warm Showers guest: a young Brit named Arron who landed in New York and is cycling across the US. He’s early in his ride, not quite acclimated to cycling, and he’s getting a real baptism by fire, or at least by rain and hills and poor road choice, but he was a trooper. He stayed for two nights before heading for Coopersburg.


  • A Sojourn* Into Clustering

    Posted on by Don

    I was looking at the towpath amenities project in the week before we went on vacation, mainly to play with database reporting software, and I noticed that my amenities all were pretty closely grouped together. This stands to reason, since the data is a ready-made cluster — it’s composed of amenities within a kilometer of Sand Island, so the clustering may just be an artifact of that search criterium — but also because the data set encompasses the compact  Main Street restaurant district. Continuing on with my reporting experiments, I looked at all amenities within a mile of Sand Island, and now found myself looking at two distinct groups of amenities, the one around Main Street, and another on the south side of the Lehigh. This also stands to reason — Chamber-of-Commerce types like to joke that we’re the city with two downtowns — but again I wondered if it was some artifact of the analysis, or even if I was seeing patterns that didn’t really exist, and that got me thinking of what I actually thought I meant by “cluster.”

    Turns out, it’s a fairly big subject, with different ways of describing what “cluster” might mean — usually (and intuitively), it’s a subset of similar items within a larger data set, but then what does “similar” mean, and how similar do the members of a cluster have to be, especially compared to the rest of the set? For each way of understanding what a cluster is, there are various ways of finding the clusters within a data set. This whole subject is apparently a big deal, a subject of ongoing research, and an important tool in the fields of machine learning and big data.

    My problem was spatial, so for me “similar” meant “close together in terms of location.” Some Googling found that there were plenty of GIS solutions to clustering problems, and in fact PostGIS contains several functions implementing the more common and important clustering algorithms, including DBSCAN, the algorithm that comes closest to what I think “clustering” should mean for my situation.

    And here is where things became complicated…

    The clustering functions are not available in the version of PostGIS that I had installed. So I decided to upgrade PostGIS, did a bit of research and found many articles with titles like “How to Brick Your Database By Updating PostGIS.” The process itself is not difficult, it uses old-school “make” rather than a package manager, and the pitfalls are easily avoided, but now I was scared and I thought I’d better back up my whole database system before continuing. What this meant though, was that first I had to make room on my hard drive, which has one (small, overcrowded) main partition and a (large, empty) secondary area. First thing would be to back up the secondary partition to the NAS drive — something I’ve been remiss on ever since I installed Mint — then I’d move both my music (35 GB) and my photos (12 GB) over to the secondary drive, and then update the music and photo software so it knew where all the files went — it was starting to sound like that song about the hole in the bucket…

    I got through the first part, backing up the drive (which took hours), before we went on vacation. There was no Internet at our cabin, and I didn’t bring my computer anyway, so the rest had to await my return. The remainder of the hard drive cleanup (music and photos) also took some time but went smoothly enough, and I did a full backup of my databases.

    From here the process was a bit anticlimactic: I downloaded the new version, ran make and typed a few things into the database, and I was done without bricking a damn thing. I needed to lay on my fainting couch and rest for a day after that, but when I finally got around to using the new functions they were a breeze.

    I found some clusters and drew polygons around them — the subjects of another post —  but I have more to do to figure out what these things are actually telling me.

    *Hat tip to Achewood, still my favorite Internet thing ever.


  • New Maps Marker Plugin Test

    Posted on by Don

    Here’s another map plugin, called “Maps Marker.” This one is also based on Leaflet, but seems to have many more features, at least at first. Here’s a simple map:

    [mapsmarker layer=”2″]

    This may take some work to bring it up to speed: you have to load your own marker icons etc, and many features (e.g., GPX tracks) are unavailable, unless you get the Pro version — at €249 for the license, no thanks! Meantime, the actual markers didn’t even show up on the map (though they did show up on the post preview), let alone the pop-ups — again, this may be a problem with my theme, though explicitly creating a map for one specific marker does show up (sans pop-up or tooltip):

    [mapsmarker marker=”3″]

    It looked for a second like we were getting close, but still no cigar.

    UPDATE: I added some experimental CSS to this post, which at least made the pop-up content show itself more reasonably.


  • New Leaflet Plugin Test

    Posted on by Don

    I’ve decided to make my own maps here for posting about rides, and maybe for some other mapping tasks I might want to do, so I’m experimenting with map plugins. The first one is something called “Leaflet Map,” let’s see how this looks:

    Hmmm, seems OK, but there aren’t all that many options straight out of the box — I especially would like to be able to center the map, for one thing, and the map design (on the back end) seems pretty text based. Default tile server is standard OpenStreetMap, but there is an option for Mapbox (with a place for your API key), as well as other map tile providers — though I don’t see how to set the API key for anything other than Mapbox. This could be a problem for, say, ThunderForest tiles, which are my favorite map tiles and also require a key.

    Meanwhile, try clicking on the marker: a pop-up appears, but the pop-up is apparently only one letter in width, and its background is transparent, and I don’t see any easy way to change these. (These may be due to issues with my WP theme, but I like my theme and I don’t want to change it.) Like I said: Hmmm…

    If I keep using this map plugin, I may have to build a custom container for it, div tags and custom css, with a place for titles, etc. I have other plugins to try before it comes to that.

    UPDATE: I added some custom CSS for this one post, and it seemed to at least allow the pop-up content to show up. So there’s that…


  • Data Cleanup Automation Fun

    I’m still playing with LANTA’s bus routes data, girding myself for — eventually — adding the bus routes into OpenStreetMap, but I recently decided to rebuild my data, basically starting over from scratch with the PDF’s I got from the LANTA website. My current workflow is:

    PDF  —> CSV —> cleaned-up CSV —> GeoJSON —> cleaned-up GeoJSON —> (eventually) a PostGIS database

    The conversion from PDF to CSV was automatic, using a Java program I found online, and the CSV cleanup — fixing things like transposed latitude/longitude, missing minus signs etc — was done manually (using a text editor and LibreOffice Calc), which was relatively uneventful but  laborious — there are 68 individual bus routes, each with its own file.

    Things got even more laborious with the next two tasks. My first go-around with the conversion to GeoJSON was done manually within QGIS: load each of the CSV files, individually filling out the required parameters for each one. I wasn’t looking forward to converting the files individually, so I wrote a Python script to save all my route layers in GeoJSON format. (Just as an aside, I have to say I really like GeoJSON as a vector file format: I find it much easier to work with than the dated, unwieldy Shapefile standard; it’s also easier to open and work with in the JOSM editor. All my new data, if it’s not going into the database, is getting stored as GeoJSON files.)

    The “GeoJSON cleanup” is where I massage the data into the forms I want: some of the table columns are unnecessary, some need to be renamed, there are a few extra columns to add (and populate), and finally I wanted to convert the LANTA bus stop names format (in  Robbie-the-Robot-style ALL CAPS) to something a little easier o the eyes. Doing this manually would have been beyond laborious, so I wrote another Python script to massage the route files. This turned out to be more of a learning experience — as in, multiple versions of the program failed spectacularly until I got it right — and probably took longer than the brute force, manual changes approach would have, but at least it wasn’t laborious…

    I’m still not really sure why this version worked when others did not, but here is my code:

    # script to run through all visible layers,
    # adding/deleting/renaming fields as required
    # to convert from LANTA bus data to something
    # more like OpenStreetMap bus stop attributes
    # it also properly capitalizes feature names

    from PyQt4.QtCore import QVariant
    import re

    # some functions and regular expressions for string manipulation
    def match_lower( matchobj ):
    return matchobj.group().lower()
    def match_upper ( matchobj ):
    return matchobj.group().upper()
    reg = re.compile( 'Lati|Longi|Time|At Street|On Street|Direct|Placem' )
    reg_ns = re.compile( r'\(ns|fs|mid|off\)|\bncc\b|\bhs\b', re.IGNORECASE )
    reg_nth = re.compile( r'[1-9]?[0-9][a-z]{,2}', re.IGNORECASE )
    reg_leftParen = re.compile( r'([^\s])(\(\w*\))' )
    reg_rightParen = re.compile( r'(\))([^\s])' )
    reg_space = re.compile( r'\s+' )

    for layer in iface.mapCanvas().layers():

    # reset these variables for each new layer processed

    myLayerName = layer.name()
    highwayExists = False
    networkExists = False
    operatorExists = False
    publicExists = False
    busExists = False
    routeExists = False
    delList=[]

    layer.startEditing()
    pr = layer.dataProvider()

    # change the names of some fields
    fields = pr.fields()
    count = 0
    for field in fields:
    fieldName = field.name()
    print "test for changing field name " + fieldName + " count ", count
    if ( fieldName == 'Public Information Name' ):
    print 'changing to name'
    layer.renameAttribute( count, 'name' )
    if ( fieldName == 'Stop Number' ):
    print 'changing to ref'
    layer.renameAttribute( count, 'ref' )
    if ( fieldName == 'Stop Order' ):
    print 'changing to stop_order'
    layer.renameAttribute( count, 'stop_order' )
    count += 1
    layer.updateFields()

    layer.commitChanges()
    layer.reload()
    layer.startEditing()
    pr = layer.dataProvider()

    # delete some fields
    fields = pr.fields()
    count = 0
    for field in fields:
    fieldName = field.name()
    print "test for deleting fields " + fieldName + " count ", count
    m = reg.match( fieldName )
    if m:
    print fieldName
    delList.append( count )
    print delList
    count += 1
    pr.deleteAttributes(delList)
    layer.updateFields()

    layer.commitChanges()
    layer.reload()
    layer.startEditing()
    pr = layer.dataProvider()

    # add some fields, checking if they don't already exist
    count = 0
    fields = pr.fields()
    for field in fields:
    fieldName = field.name()
    print "test for adding fields " + fieldName + " count ", count
    if( fieldName == 'highway' ):
    highwayExists = True
    print 'highway', count
    if( fieldName == 'network' ):
    networkExists = True
    print 'network', count
    if(fieldName == 'public_transport' ):
    publicExists = True
    if(fieldName == 'bus' ):
    busExists = True
    if ( fieldName == 'operator' ):
    operatorExists = True
    if( field.name() == 'route' ):
    routeExists = True
    count += 1
    if( not highwayExists ):
    print "adding highway"
    pr.addAttributes( [ QgsField("highway", QVariant.String) ] )
    layer.updateFields()
    if( not networkExists ):
    print "adding network"
    pr.addAttributes( [ QgsField("network", QVariant.String) ] )
    if( not operatorExists ):
    print "adding operator"
    pr.addAttributes( [ QgsField("operator", QVariant.String) ] )
    if( not publicExists ):
    print "adding public_transportation"
    pr.addAttributes( [ QgsField("public_transport", QVariant.String) ] )
    if( not busExists ):
    print "adding bus"
    pr.addAttributes( [ QgsField("bus", QVariant.String) ] )
    if not routeExists:
    print "adding route"
    pr.addAttributes( [ QgsField('route', QVariant.String) ] )
    layer.updateFields()

    # add attributes to new fields for all features
    for feature in layer.getFeatures():
    feature['highway'] = "bus_stop"
    feature['network'] = 'LANTA'
    feature['operator'] = 'Lehigh and Northampton Transportation Authority'
    feature['public_transport'] = 'platform'
    feature['bus'] = 'yes'
    feature['route'] = myLayerName
    layer.updateFeature(feature)
    layer.updateFields()

    # clean up text in name field
    fieldName = 'name'
    for feature in layer.getFeatures():
    myString = feature[fieldName]
    myString = myString.title()
    myString = reg_ns.sub( match_upper, myString )
    myString = reg_nth.sub( match_lower, myString )
    myString = reg_space.sub( ' ', myString )
    myString = reg_leftParen.sub( r'\1 \2 ', myString )
    mystring = reg_rightParen.sub( r'\1 \2', myString )
    print myString
    feature[fieldName] = myString
    layer.updateFeature(feature)

    layer.commitChanges()
    layer.reload()

    Once I got this up and running, I realized that I wanted t do some more preliminary cleanup on my spreadsheets, so I was back to square one. I couldn’t really find out how to do a bulk load of my CSV files into QGIS, and I realized that QGIS was just using ogr2ogr under the hood, so I decided to do the bulk converting, CSV to GeoJSON, with a shell script that calls ogr2ogr. Yet another learning curve later, and it works great. More code:

    for i in *.csv
    do
    echo $i
    tail -n+2 $i | ogr2ogr -nln ${i%.csv} -f "GeoJSON" ${i%csv}geojson \
    CSV:/vsistdin/ -oo X_POSSIBLE_NAMES=Lon* -oo Y_POSSIBLE_NAMES=Lat* -oo KEEP_GEOM_COLUMNS=NO
    ogrinfo ${i%csv}geojson
    done

    It struck me then, that all my data was really text, and so working with it in a more unix-ey fashion, with shell scripting and text manipulation programs (sed, awk) to do the conversions directly from the CSV files, was probably my better strategy. Oh well, I did the first part of it with bash at least, and the Python script works well enough.

    UPDATE:

    I did it anyway, using awk to add/subtract/rename/Capitalize the CSV data before running it through ogr2ogr. The code (below) is about 35 lines (as opposed to 150 for the Python script, which only does part of the job anyway) and runs really fast:

    #! /bin/bash
    for i in *.csv
    do
    echo Converting $i to GeoJSON
    cat $i | awk -F "," -v rtname=${i%.csv} 'BEGIN {
    }
    $2 != "" && /Stop/ {
    print "ref,Latitude,Longitude,name,stop_order,highway,public_transport,bus,network,operator,route"
    }
    $2 != "" && /^[0-9]{4,4}/ {
    string = tolower($8)
    n=split(string,a," ")
    string=toupper(substr(a[1],1,1)) substr(a[1],2)
    for(i=2;i<=n;i++) {
    string = string " " toupper(substr(a[i],1,1)) substr(a[i],2)
    }
    t_str = "\(ns\)|\(fs\)|\(mid\)|\b[nN]cc\b|\b[Hh]s\b"
    if ( match( string, t_str, match_array ) ) {
    the_match = toupper(match_array[0])
    gsub(t_str, the_match, string)
    }
    gsub(/ *\(/, " (", string)
    $8 = string
    print $1 "," $2 "," $3 "," $8 "," $9 ",bus_stop,platform,yes,LANTA,Lehigh and Northampton Transportation Authority," rtname
    }' > test1.csv
    cat test1.csv
    ogr2ogr -nln ${i%.csv} -f "GeoJSON" ${i%csv}geojson test1.csv -oo KEEP_GEOM_COLUMNS=NO
    ogrinfo ${i%csv}geojson
    rm test1.csv
    done


  • This Week Today

    Stopping by again…

    Mapping: I had, and still have, a few technical issues to deal with, but the full Lehigh Valley database is now in PostGIS, along with elevation data — bogus elevation data, that’s one of my technical issues — and the demo map can now route with the new database. But it’s got the slows, it’s got the slooowws… With about 3200 road segments in the “toy database,” it could route in about 1-2 seconds, but the full-map version took about 6 seconds per routing task — and there may be multiple routing tasks in each route, from start point, to via point and then through subsequent via points, and finally to the endpoint. Unacceptable!

    I did some searches online, and sure enough there are a lot of people complaining about pgRouting performance and looking to speed it up. The general consensus: there are a few things you can do, including tune your database, but the actual bottlenecks are the pgRouting algorithms. Some suggested using osm2po, another program that converts OpenStreetMap data for databases but can  also do routing: tried it and it’s blindingly fast – d’oh! (Unfortunately, I didn’t see much there in the way of customized, dynamic cost functions, so I can’t see how to turn it into the the answer I’m looking for.) I tried a bunch f the Postgres/PostGIS performance-tuning tips anyway, and they did seem to help a little.

    I eventually came across one potential solution: route only on a subset of the roads in the database, using a bounding box. For each pair of points to route between, I find the smallest rectangle that contains both, then expand it by 2000 meters in every direction (like a buffer zone); this is my bounding box, and the routing search is limited to the roads that touch or fall within that box. This seemed to do the trick: my routing times are back down to about 1-2 seconds.

    Except near — wait for it — those confounded bridges. The valley is broken up by the Lehigh river, with occasional bridges, and if there are no bridges within the bounding box for a route that needs to cross the river, no route will be found. Meanwhile, when routing points are on a diagonal, the bounding boxes are fairly big, but routing points that run mainly east-west or north-south produce long, skinny bounding boxes. I found a few “dead zones” where routes couldn’t be found, especially east-west ones north of Northampton, routes with skinny bounding boxes where the bridges are a little sparser. My original bounding boxes were expanded by a buffer that was only 1000 meters; I went to 2000 meters in an attempt to alleviate the bridge problem. This didn’t solve it entirely, but it did help, and there was no real performance hit going from 1000 to 2000 meters. I’ll probably look at distances between bridges, and revise my buffer zone to be just bigger than say, half that distance.

    Reading: I picked up Don DeLillo’s Underworld again, intending to just read the first part. I love the first chapter but never finished the book because I found the rest boring; now I am engrossed and don’t know what I was thinking back  then.

    Listening: WXPN has been playing “The 70’s, A-Z” this past week, every song they have in their library that was released in the Seventies, played in alphabetical order. We’ve been following along religiously, and it’s been fascinating and fun but they’re only up to “T,” and it gets wearing. Full disclosure: the radio is off right now…

    The only time they weren’t playing the 70’s was for their Friday “Free at Noon” concert at the Word Cafe, which this week featured Russ’s band Cherry. So, we went down to Philly with Ray and Lorraine, where we met Frank and Patricia, and Ben, and Gabby, and we all watched the show and then went out to lunch with Russ at the White Dog Cafe. As always, we spent a few minutes at Penn Books before the ride home. All the talk in Philly, among us and overheard on the street, was about the upcoming snow on Saturday…

    By the way, Saturday was Luminaria Night in Bethlehem, here is a photo of ours:

    candles in bags on sidewalk
    Luminaria Night

    One last thing: here is what I wrote ten years ago.


  • On The Bridge: One Step Forward, Two Steps Back

    Talk about hedonic adaptation! A week or so ago I was sure I was far from ever being able to route on my web map using pgRouting, then a triumphant breakthrough, and now here I am, annoyed that it’s not perfect…

    My first problem is a data issue, and a recurring one in my mapping and routing life: dealing with bridges. Once I got the routing to work, I started to customize it with a separate “get_cost” function, which deals with ascent and descent (other criteria are coming), and that worked fine. Then I noticed that the routes seemed a little off, like they were avoiding what I thought would be the optimal routes, the main one being that it would do a lot to avoid a certain section of Broad Street. That’s when I remembered: there are several bridges on that section, and rather than following the elevation of the bridge’s road surface, my elevation data followed the contours of the ground below it, leading to large ascents and descents along that section.

    To solve the immediate problem, I changed the ascent and descent to be zero for the section containing the bridge — close enough to the truth, for that short a span on a mostly flat road. That made the routes in the vicinity more sensible, but what to do about other bridges?

    I think I have three options: I can either find the actual elevation data for the top of the road surface (using a “digital surface model” rather than “digital elevation model” and probably using LIDAR rather than satellite radar data), or I can assume that the bridge has a mostly constant slope, and calculate the slope from elevations where it attaches to the ground, or I can save myself a lot of work and just say “they’re flat, or flat enough to make no difference,” and make all ascents and descents be zero for bridges. I am still thinking about this…

    The second problem is a little harder to figure out, since it involves the PostGIS routing function I got off the Internet: when the beginning and end points of the route are on the same segment of road (ie there are no intersections between them), the function fails. I don’t know enough about Postgres functions to be able to solve this, so I may have to either live with it for a while, and contact the person who wrote the function for some help.


  • Excelsior!

    I thought this would take so much longer… I have a web map designed and working, and I was able to add generic routing functionality to it (via the Leaflet Routing Machine plug-in). Here’s a screenshot:


    A screenshot from my web map showing a path around town, using the Leaflet Routing Machine and my PostGIS/pgRouting database.

    The actual routing engine on the server side is done with PostGIS/PgRouting, accessed through a PHP script — Leaflet Routing Machine does not normally work with PostGIS,  but I found another plug-in (called lrm-pgrouting), which included a PostGIS function and some Javascript, to add this functonality. Unfortunately, the unmodified lrm-pgrouting plug-in requires something called Geoserver (rather than just a plain old PHP script) to talk to PostGIS, but it was easy enough to modify the plug-in to use PHP, and writing the script itself was the easiest part of the whole thing.

    Once I got routing up and running, I came across a few problems, mostly with how the directions are displayed: the display only showed street names and distances — that is, no turn information — and, for wherever the route continues straight on the same road through an intersection, there is an unnecessary instruction to “go straight.” Both of these were due to errors in lrm-pgrouting which I managed to fix to my liking.

    So, success! But this is using a generic routing function, rather than the “climbing vs busy road vs recommended commuter routes” function I ultimately want to use, so there’s some room for improvement. I also think I may want to abandon the Leaflet Routing Machine and do the input and display on my own. Also also, all this stuff currently resides only on my laptop; I have to find a host that will let me run a PostGIS database (among other things). I still have some work to do.