This is my second post in a series, where I report back on my results from playing with various ways to use routing, in QGIS and related programs. My immediate task is to identify those cycling amenities that are nearest to access points along the Lehigh Towpath. You can read Part 1 (the introduction) here. In this post, I’ll be using the QGIS built-in Network Analysis Library. Follow along after the break…
The routing library was originally the back end for a plug-in called Road Graph, which could find the shortest path between two given points, as long as it was given a network of connected lines to use as roads. I played with the plugin before, and really does exactly what I’m looking for, except that selecting points must be done manually, one set of points at a time. I have 42 access points in my list, and 271 amenities to test against each access point, for a grand total of 11,382 separate access/amenity pairs to check, so checking them all manually was out of the question. Many commands have options for automatic processing, but all Road Graph has is that bare-bones library, which means I’d have to write my own process using Python.
The Code
Writing my own process turned out to be surprisingly easy, mainly because I cheated: I was able to find some Python scripts via Google and Stack Exchange, and selected one that seemed close to what I needed to do. I did a little tweaking, and with a little trial and error I got it to work. Here’s my code:
#Definition of inputs and outputs
#==================================
##Routing tools=group
##access=vector point
##amenities=vector point
##network=vector line
##distance=number 1600
##Routes=output vector

#Algorithm body
#==================================
from PyQt4.QtCore import *
from PyQt4.QtGui import *

from qgis.core import *
from qgis.gui import *
from qgis.networkanalysis import *

from processing.tools.vector import VectorWriter

progress.setPercentage(0)

access_layer = processing.getObject(access)
amenities_layer = processing.getObject(amenities)
network_layer = processing.getObject(network)
writer = VectorWriter(Routes, None, [
  QgsField("acc_id", QVariant.Int), QgsField("amen_id", QVariant.Int), \
  QgsField("length", QVariant.Double)], network_layer.dataProvider().geometryType(), \
  network_layer.crs() )

# prepare graph
vl = network_layer
director = QgsLineVectorLayerDirector( vl, -1, '', '', '', 3 )
properter = QgsDistanceArcProperter()
director.addProperter( properter )
crs = vl.crs()
builder = QgsGraphBuilder( crs )

# prepare points
access_features = processing.features(access_layer)
access_count = access_layer.featureCount()
amenities_features = processing.features(amenities_layer)
amenities_count = amenities_layer.featureCount()
point_count = access_count + amenities_count

points = []
ids = []

for f in access_features:
  points.append(f.geometry().asPoint())
  ids.append(f['acam_id'])
for f in amenities_features:
  points.append(f.geometry().asPoint())
  ids.append(f['acam_id'])

progress.setPercentage(25)
tiedPoints = director.makeGraph( builder, points )
graph = builder.graph()

route_vertices = []

for i in range(0,access_count):
  progress.setPercentage(50+int(50 * i/ access_count))
  from_point = tiedPoints[i]
  from_id = graph.findVertex(from_point)
  (tree,cost) = QgsGraphAnalyzer.dijkstra(graph,from_id,0)

  for j in range(access_count,point_count):
    to_point = tiedPoints[j]
    to_id = graph.findVertex(to_point)

    if tree[to_id] != -1 and (cost[to_id] <= distance or distance <=0):
      # collect all the vertices between the points
      route_points = []
      curPos = to_id
      while (curPos != from_id):
        route_points.append(
          graph.vertex( graph.arc( tree[ curPos ] ).inVertex() ).point() )
        curPos = graph.arc( tree[ curPos ] ).outVertex()

      route_points.append(from_point)

      # add a feature
      fet = QgsFeature()
      fet.setGeometry(QgsGeometry.fromPolyline(route_points))
      fet.setAttributes([ids[i], ids[j], cost[to_id]])
      writer.addFeature(fet)

del writer
Basically, my program loads a bunch of libraries, initializes the network (adding all my points, access and amenity, to the network as it goes along), then, separately for each of my access points it uses Dijkstra’s Algorithm to find the shortest path to each of the other points — luckily, this routine was supplied by the network library, and I didn’t even have to figure it out myself, just follow along with what I found in that example script.
So for each access point, once the script has all the shortest paths from that one point, it looks at each amenity point in turn, checks the length of its shortest path back to the access point, and grabs any path that was shorter than my specified maximum length (1600 meters, or about a mile), along with the ID’s of the access and amenity points and the path length, and output that to my new vector layer. (I decided to throw away all the paths that were over a certain length, because there were just so many of them, I didn’t want to waste the space with the useless ones.)
Then it does the same (find all routes, harvest the shorter ones) for the next access point in turn, until it completes the list.
My final output is a line vector layer of all the routes between the two sets of points, that fit my maximum distance criteria, along with attributes for each route identifying the start (access) and end (amenity) points, as well as the actual length of the route. All this info should be obvious by inspection on a map, but I may eventually use these attributes in database queries — think inner join.
Running The Code
It couldn’t be easier: launch the script (from within the QGIS Processing Toolkit) and the first thing you see is this window:
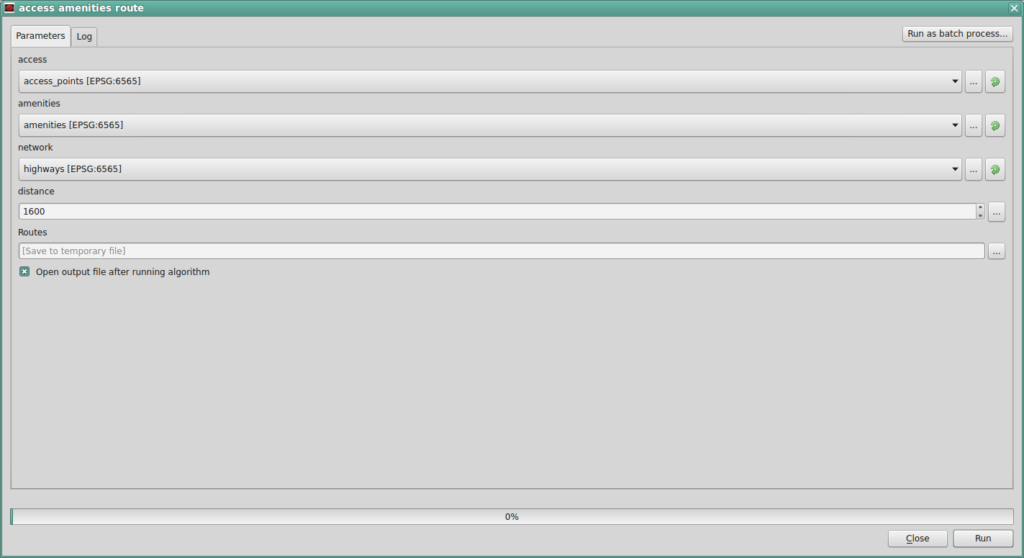
I have this filled out with the access, amenities, and network vector layers, and haven’t changed the default maximum route distance of 1600 meters, but didn’t bother to set an output file name — QGIS will automatically generate a temporary file. Press “Run” and off it goes, with the progress bar at the bottom showing how it’s all going. (Watching the progress bar, I think the most time consuming single part of the process is building the network, everything else moves pretty quickly.)
When it’s one, the new layer shows up in the map.
A Look At The Results
The process returned 229 results. Below is a close-up of the routes found within downtown Bethlehem, basically the ones starting from the Sand Island access point. (The red and yellow star is the access point, yellow dots are the amenities, the cyan lines represent the road network and the thicker red ones are the routes, and behind it all I put an aerial view for context.)
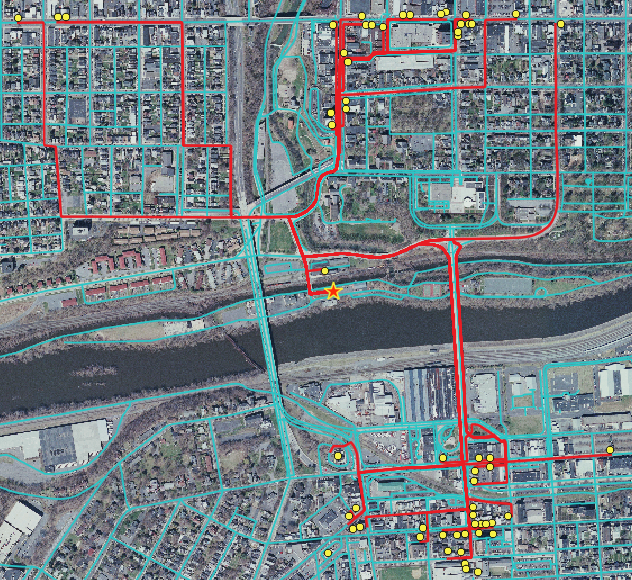
This is pretty much what I expected to see. Success! Next up (Part 3 in this series of posts, which will happen when it happens) will be my attempt at using the GRASS plugins. I may post a closer look at these results, but we’ll see.

Pingback:Experiments in Routing, Part 1 – The Other Don Kelly