A friend sent me a video how-to to build a 3d map the other day, and while I thought it was really cool I didn’t want to use the software in the video. I have some pretty good stuff already, I thought, and tried to find a way to do it with either GRASS or QGIS. GRASS was a bit of a bust: I really hate the interface they use for 3d, and couldn’t find much on how to drape one layer over another — it used to be easy!
QGIS wasn’t much better, but then I am a few versions behind. There is a plugin, however, which enabled me to make a 3D map website. So here’s mine:
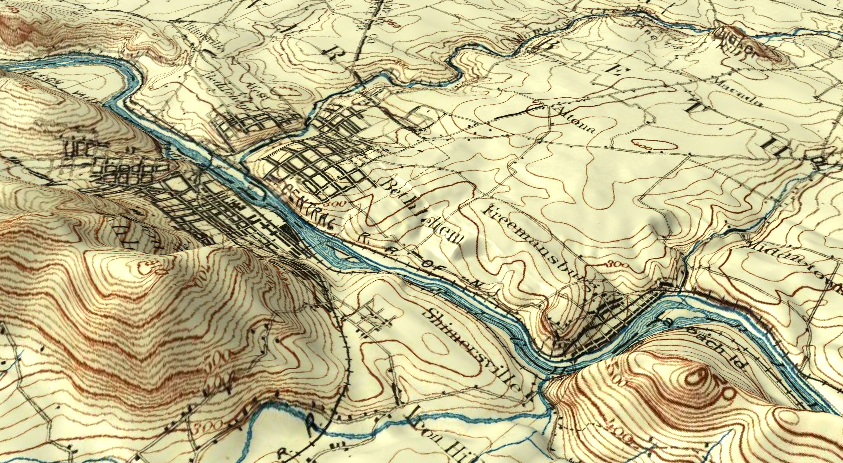
I used the USGS topographic map from 1894, and “draped” it over the DEM I made for the Lehigh Valley cycle routing project (which DEM unfortunately has height in feet rather than meters, so the hill heights scale a bit big). The view in the picture is of Bethlehem and environs, with South Mountain and Lehigh Mountain on the left, and the Camel Hump, back when it was still Quaker Hill, in the upper right. Click the image and it’ll take you to the map website.
I noticed, when playing with that topo map, that for things like roads it doesn’t align everywhere with current maps. The map was provided with a CRS by USGS, but I suspect it was guesswork: there is no projection or datum information on the map itself. (The corners do line up exactly.) This may be because of surveying inaccuracies, back then or even for modern maps — I’m mostly using OpenStreetMap, after all — or it could be that the roads themselves were moved or straightened over the years, or they guessed wrong with the CSR. I thought it interesting then, that on the 3D map the hills and contour lines line up as well as they do: the surveyors knew where the hills were, at the very least.