• Category Archives tech talk
  • Computers and programs, maps and GPS, anything to do with data big or small, as well as my take on the pieces of equipment I use in other hobbies — think bike components, camping gear etc.

  • Obsidian Dreams

    So I haven’t been writing much, here, but I have been experimenting with some software I ran across called Obsidian. Billed as a “flexible writing app” and lauded as “a second brain,” it’s basically a markdown enabled text editor with built-in file linking structure — almost like a simplified reinvention of the Web on your local machine. It’s used as a note-taking or idea-generating app, and it’s generated a lot of hype in some circles…

    I’m currently giving it a go, using it to document all the moving parts in my Native Paths project, and also to organize my thoughts for a postmortem of my experiences with the Road Scholar program.

    I find the app pretty easy to use (for my simple purposes), and I have to say it’s really nice and well-made, it’s an actual pleasure to use but I’m struggling to see where all the hype comes from. Time will tell, and maybe I’ll see more as I use it more and explore all the other features.


  • CADOP5

    Happy Ides of March! Watch your backs, and remember: the day ain’t over ’til it’s over…

    I took a graduate-level computer-aided design course in college — way back when CAD/CAM/CAE was really not a consumer-grade product — and a good part of the course was about optimization. I happened to think about that the other day when I was idly browsing through various Python modules (the way one does), and I ran across a genetic algorithm package.

    Genetic algorithms had their own vogue a few decades back, but that long-ago was long after I left college. Still, playing with it got me to reminiscing about the the things we did way back in school, and about the program we used and our professor (Dr Michael Pappas, who was its author), so I Googled him and the program.

    Dr Pappas passed away in 2015 — I found his obituary. He was a major player in the computer-aided and biomedical engineering worlds, and was the co-inventor of the artificial knee, among other things. I knew he was a big deal back in the day, but I guess I never realized how big a deal he was. (He had a pronounced limp and a seriously deformed back/hip, so I suspect he had some skin in the artificial joint game.) He was fairly intense, and was one of those guys who always seemed on the edge of blowing his stack, though in fact he was always decent and patient with us students. That was one of my all-time favorite classes…

    The optimization program itself was called CADOP5; it was written in FORTRAN and it was a bear to use. (I remember him telling us, at the start of the course, that we needed to start working now on our optimization project, because it couldn’t be finished in a day, or a week, or even two weeks… I was probably the only one in the class to get an A on the project, and I wasn’t even able to find the optimum solution — though I was able to say why.) When I searched for CADOP5, I didn’t find much except this thesis at NJIT. The program given in that paper was a refinement called CADOP8; I might have met the student working on it at some point, but he had his PhD by the time I took the course with Dr Pappas.

    I really did like that class a lot, and its professor, and in fact tried to get Dr Pappas as my thesis advisor, but I got some behind-the-scenes stonewalling from one of his other students/assistants (it took naive me about a year to realize that maybe I’d been undermined), so did my thesis on linkages under Dr Sodhi, and the rest is history — or at least, water under the bridge.

    Back to the Python genetic algorithm: I downloaded it and wrote a little program to test it. It was amazingly easy to use, like all things Python, but it seemed pretty slow to me. (High computation cost? Slow convergence? No idea.) There are many other optimization critters out there in the Python ecosystem, I wonder how they would stack up against that one particular genetic algorithm module, or against those ancient CADOP programs for that matter.

    Anyway, something from the Wayback Machine: this and this are what I was writing fifteen years ago, maybe a month or so before I met Anne.


  • The Corliss Comes Alive

    Happy Pi Day! Here is that post about the steam engines.

    The National Museum of Industrial History has a few gigantic, spectacularly beautiful old restored steam engines, some of them even in operating order. I’ve seen the steam exhibit before, but I have been meaning to go back to the museum to see it again, because my friend Donna’s father just helped restore a new one they got. (George is a retired woodworker and very handy.)

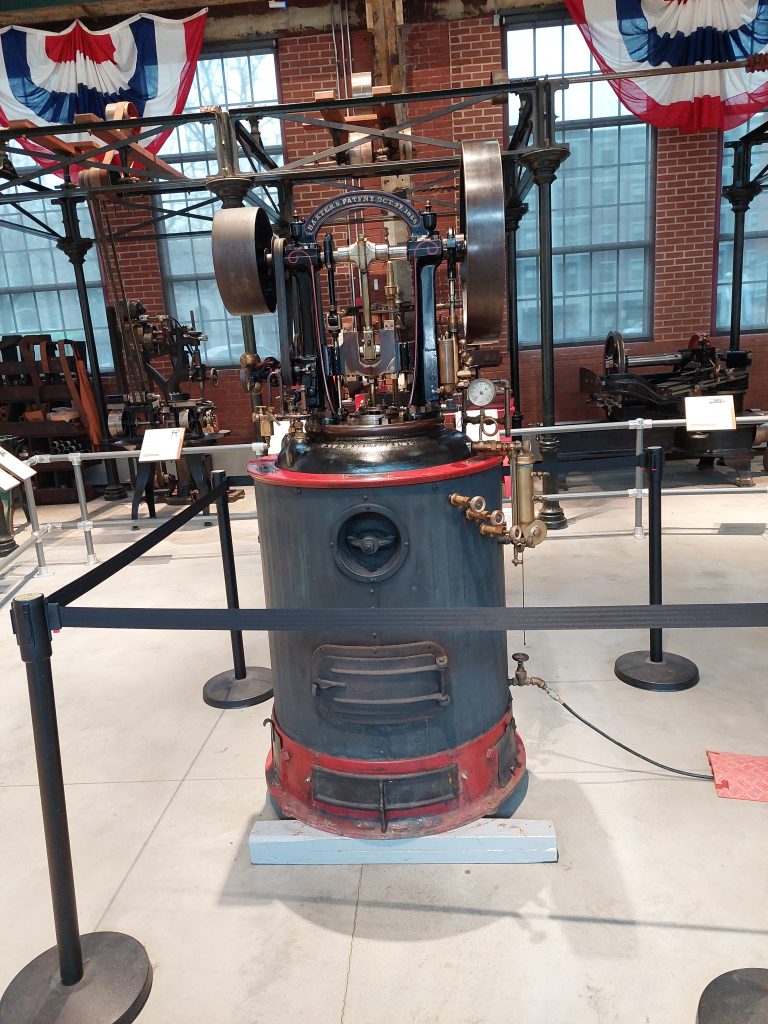
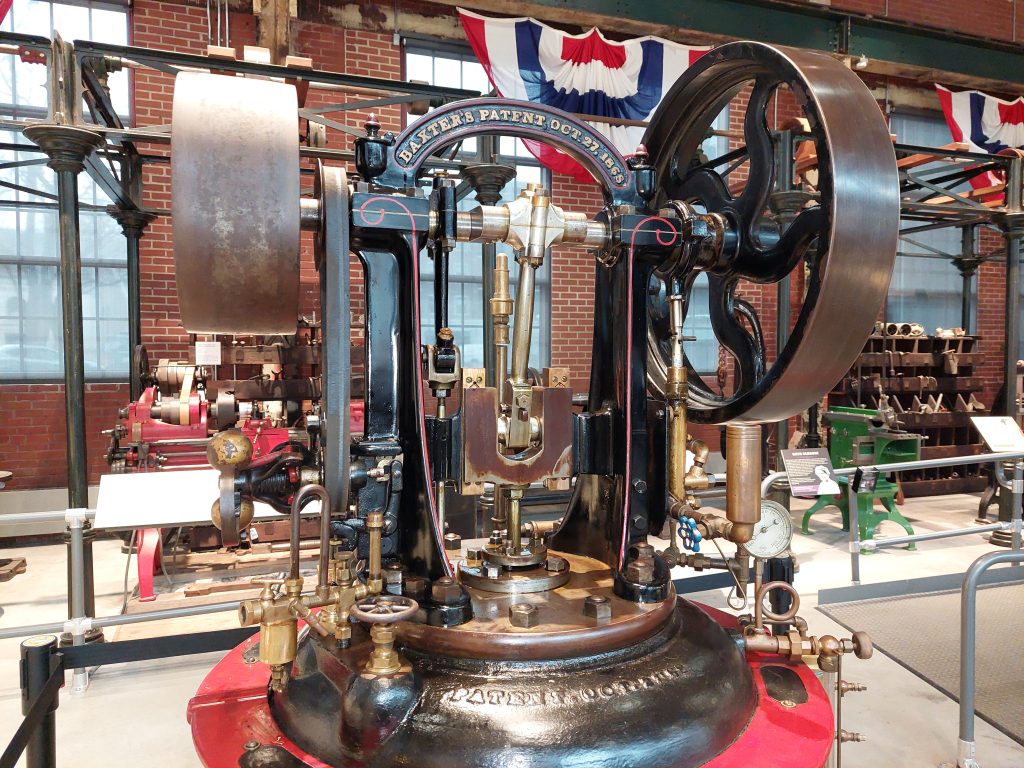
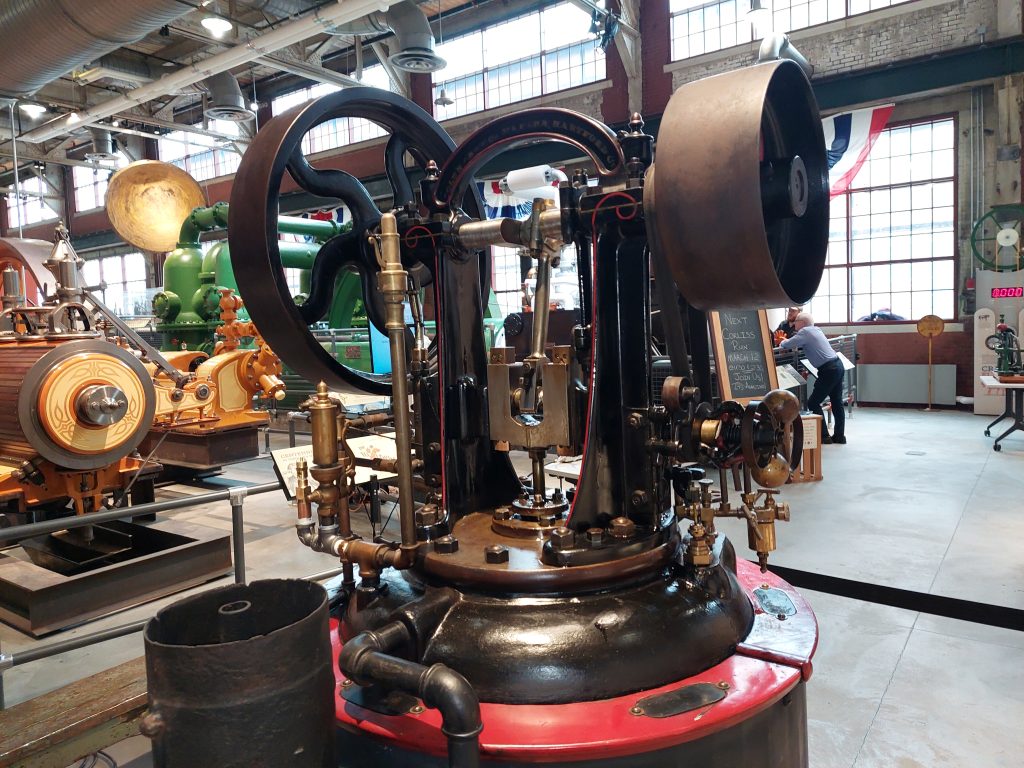
    That new, and newly restored, addition to their collection is a Colt-Baxter “portable steam engine,” patented by a guy named Baxter and manufactured by Colt Firearms as a way to diversify after the Civil War. The Baxter was “portable” in the sense that it was only as big as a big barrel rather than building-sized; it ran at about 15 psi steam pressure and put out about 10 horsepower, was built to run a belt drive, and was ideal for powering small factories, machine shops etc — they sold maybe 300,000 of them over the years. (I learned all this at the Museum on Sunday, and on the Internet yesterday…)

    The museum had a demo day Sunday, where they would power up their Corliss engine — the biggest steam engine they have, and beautifully restored — using compressed air. I figured I’d kill three birds with one stone by riding the Iguana over for a test ride, watching the Corliss in action, and seeing the new Baxter engine on display.

    Here’s a video I made of the Corliss:

    At about 19 seconds into the video you can see what makes a Corliss engine a Corliss: the spider-web of levers running off a central rotating plate are what control the steam valves that feed the pistons. This engine was used to run a water pump; I’m pretty sure that the black part (the front) is the steam engine end, and the green part at the back is the water pump.

    And, here are a few photos I took of the Baxter:

    Colt-Baxter Steam Engine

    (Along the wall in the background, you can see some belt-driven machines on loan from the Smithsonian, drills and lathes and such, that the Baxter would have powered.) The Baxter had its own furnace/boiler built into the lower section, with the piston inside the top of the “barrel” and the bulk of the machinery on top.

    The museum had a few other exhibits, including a few small model engines running, as part of the demo, and one final surprise for me: the Baxter engine was operational! They didn’t have a fire running inside it, it was all compressed air like the Corliss, but here is a video of the operator starting it up:

    In all, a banner day!


  • Getting Ready For Spring

    I’m prepping for the upcoming Road Scholar rides later this month, and part of that means getting the Iguana back in shape. There’s not much to do really, but I did replace the handlebar grips and the chain. (As an aside: when did quick links — excuse me, “power links” — become so hard to use?) The chain was “stretched” (i.e. worn) a bit but not too much, so I did not expect to need to change out any more of the drivetrain — the wear manifested mostly as a bit of lateral flex, which I suspect messes with shifting. Chain and new grips took me maybe a half hour or so to replace; I did it about a week ago and took it on a few short test rides, and everything seemed in order. Sweet!

    Fast forward to last Monday, when I went out with Anne to do a reconnaissance of the Allamuchy RS route. We didn’t quite prepare ahead of time: I wanted to bring the Kona but couldn’t fit it either on the roof rack (not without an adapter I couldn’t find), or on the rear rack with Anne’s touring bike. D’oh! I put the Kona away and put the newly-refurbished Iguana on the roof rack, and off we went, only 45 minutes late…

    We got to the start and got riding, and within a mile I had issues with the chain skipping on the rear cogs — a sure sign that I should have replaced the cassette. No matter, I was able to find some gear combinations that worked, and the ride itself was very enjoyable — Anne had never done this ride, and I was glad to see she really liked it.

    Our ride:

    As soon as we got home I ordered new chain rings and a new cassette. They arrived Friday and I put them on yesterday — after running over to Doug’s, to borrow some tools I could not find in the basement mess, and today I rode it over to the Museum of Industrial History on Southside to watch them run their steam engines.

    But that’s for another post. For now I think the Iguana is running great.


  • Through The Trees

    Well, it’s over: I got it out of my system.

    I don’t even remember why, but I’d been thinking about trees lately (the comp-sci/data structure kind), and that slowly built into a mini-obsession. B-Trees, R-Trees, indexes, recursion… I found myself reading old programming books and Wikipedia articles until I was just about ready to go insane. In all of this, I was itching to find some little project to use them, and couldn’t come up with much more than “build one and look at it,” until I ran across the Wikipedia article for backtracking algorithms…

    Enter the Christmas Gift Exchange.

    Anne’s (large) family does a gift exchange every year, so that rather than everyone buying tons of stuff for everyone else, each person only buys presents for one other family member. (Kids are exempt, they still get tons of presents from everybody.) This keeps things more manageable, and more affordable for the givers, and it tends to make the gifts more meaningful too. Gift givers get their people assigned randomly, and who you’re buying for is supposed to be kept a secret until the exchange at the Christmas party.

    The usual selection process happens after Thanksgiving dinner, when Anne and her sisters put everyone’s name in a hat, and someone pulls names to match against the list of participants. So far so good and pretty random, but there are other considerations: spouses maybe shouldn’t buy for each other, ditto parents and children, or someone ends up buying for the same person several years in a row — the “selection committee” would re-do a selection if the original draw seemed really unacceptable. Then we all get our slips of paper and start our shopping.

    I end up thinking off and on (usually just after Thanksgiving),that this rigamarole could and maybe should be automated, especially in light of the need to keep things random while also avoiding unacceptable giver/receiver combinations. I thought of a few ways that it could be done, and eventually started thinking of this as a problem in graph theory, where each participant could be considered a node in the graph, and each possible gift exchange would be an edge connecting between giver and receiver. Then maybe the problem could be looked at as a problem in traversing the graph, and the solution might look something like Dijkstra’s Algorithm. That was all well and good, but I don’t know enough graph theory to even be dangerous.

    But thinking in those terms made the problem look like it could be handled with tree structures and some kind of recursion, and when I happened across that Wikipedia article something clicked. Hmmmm…

    I wrote a python script to hold some data structures (mostly dictionaries of name lists); once I got that down, the rest came pretty easy: how to add constraints , how to recurse through the backtracking algorithm, etc. I added a few bells and whistles and, surprisingly, the whole thing worked like a charm.

    The most ironic thing about the project is that my results were originally the full set of all possible solutions, saved in a tree structure as nested lists, but once I got the tree obsession out of my system I abandoned that to just return the first randomly selected solution.

    (Actually, that’s not the most ironic part. The most ironic thing about this is that it will never be used — the selection “rigamarole,” as I called it, is actually a fun and much-anticipated part of the holiday rituals.)


  • Fun With Networks

    So the other big news, that I didn’t actually talk about last week, is that Emmi and Kyle are looking to move back East — specifically, they are moving to Bethlehem in the spring. Awesome news! But that also means a lot of work, as they must now shop for a home long distance…

    We’re helping where we can, looking online for suitable houses, searching the neighborhoods for new “FOR SALE” signs, etc, and we went on a walk-through of one hot prospect the other day with the realtor. Emmi & Kyle participated on Zoom, and I documented the walk-through on video.

    That all worked out pretty well, but when I got home I saw my video file was pretty big, like 2.5 GB, too big for regular email, so I tried sharing it to Google Drive. I clicked the link, and it said “uploading” but there’s no progress indication, and more than an hour later it’s still hanging fire, so I canceled the upload. I figured I could just put it on my laptop and move it from there, but the USB cable was wonky and won’t connect data; I tried moving it via FTP but the file is on my auxiliary memory card and the server wouldn’t access it. Cue that song about the hole in the bucket…

    So now what?

    Well, I’d set up an SMB share on my laptop a while ago, so I can share things from the laptop to other devices on the network, but it was deliberately set up to be read-only for guest accounts — I don”t want people to be able to come along and dump arbitrary files onto my computer. What I forgot I did though, and remembered in the heat of this debacle, is that I’d also made the share read/write for an authorized regular user (like, say, me with my regular login and a password) — hmmm, maybe I’ll give that a try. The SMB connection on the phone was set up to be anonymous, so I had to change a few settings, but after that I was able to move things easily from either the phone or the laptop over to the other. I tested it on that big video file, which took some time to transfer but it worked fine, and then I just uploaded the file in the usual way to Google Drive. Easy peasy!

    (I also made those changes to my tablet settings, so I can share files the same way there.)


  • First Snowfall

    I’m sitting in the dining room, watching the snow come down — big fat flakes and a lot of them too. Usually big flakes mean the end of the storm, but it’s been dumping like this for hours now; grass is covered but the snow really isn’t sticking, it’s just a bit too warm. Still, things are sloppy out there, and the roads are slick.

    The falling snow and the cloudy winter light are beautiful, I can watch this all afternoon. It’s funny, the wind must be swirling just a little bit: in the backyard the snow falls just slightly to the left, in the middle distance it’s leaning to the right, and across the street it’s falling to the left again. Oops – now it’s all falling straight down. I think I’ll keep my eye on it for a little longer…

    Tech Talk

    A friend once told a story of how her daughter, in sixth grade or so at the time, had a homework assignment, doing some research and presenting it using PowerPoint, after which she obsessively made a whole bunch of PowerPoint presentations. It was a cute story and worth a chuckle, but the truth is I know exactly how she felt — I am constantly looking for, and constantly finding, new software for creating and presenting things, and then trying to find something to say using it.

    I suppose my maps fall into that category, and so does that Jaspersoft report-writing software for database reports. It’s almost laughable how I try to shoehorn maps and databases and reports into things… My latest obsessions these days are notebooks: Jupyter notebook and especially R markdown.

    To be fair, I do have a use case for these: I’ve been looking at PennDOT’s crash data for 2021, at the behest of a friend who was interested in extracting information about pedestrian crashes. (The data from PennDOT is pretty convoluted: it comes in multiple, cross-referenced, spreadsheet-like CSV files, and it’s really meant to be used in a database.) I put this data into a QGIS project as well as into Postgres and extracted some of what my friend was looking for, then realized I could do better by running the results through R, which is built for statistics and has a lot of really cool graphing/charting capabilities.

    That worked pretty nicely, but I then realized that I should probably document my workflow, and my data sources (I’d tossed in some population and road data, and I was on the verge of losing track of what came from where), and I should also put the results into some narrative form.

    Enter notebooks. I’d heard a lot about Jupyter Notebooks and gave it a try, but in the end I settled on R markdown for my documentation. It’s pretty easy to use and produces some good-looking results — and my little project now looks like an over-ambitious high school lab report…

    As usual, with success came escalation, but I’m having fun.


  • Fun With Rasters

    I’ve been experimenting with raster data lately, photographing trail maps from Indian Paths of Pennsylvania and then digitizing them for use as map overlays in my project (I rough in the paths by tracing over them on the maps). This has worked really well, at least for when there is a path on the map — alternate paths are sometimes missing — but it came with a few problems:

    • The digitized maps (georeferenced to match my map and converted to GeoTIFF format) look great, but the first one I did weighed in at a whopping 27MB. Since I expect to generate at least a hundred of these, that’s a significant amount of disk space.
    • The maps start out as color photographs, and once they are in map form there is a lot of extraneous stuff that overlays (and blocks) the basemap beneath it.

    So, I came up with a workflow that brings in my map images while avoiding these problems:

    1. I start by taking a photo (with my phone) of the map in question, trying to get “nothing but map” in the shot.
    2. Using GIMP, I rotate and crop as necessary, then clean up the photo by making off-white sections white, despeckling, and increasing brightness/contrast. I then invert the colors, making it a B&W negative before saving.
    3. In QGIS I georeference the modified photo, using river confluences and other geographic features as my reference points. (I try for six or more “ground control” points to reference, and use the 2nd-order polynomial transformation to account for bent pages in the photo, though if the resulting transformation doesn’t look good I’ll try other options.)
    4. Finally I convert the resulting TIFF from RGB format (colors) to PCT (a sort of numeric) format, and save at half the original resolution.

    I can load the resulting raster as an overlay, and the raster pixels should be one of only two values (zero and one). I make the zero values transparent and the one values black, and now I have a very usable map overlay. The final GeoTIFF files average about 100KB each.

    This makes tracing the paths very easy, maybe too easy: I feel a temptation to take the paths as gospel, even though I have no real idea of either the original map accuracy or the accuracy of the georeferenced overlay. Then again, it is the information as given in the book, and that’s what I set out to capture. Anyway, it’s a good first step. I’ve done about a dozen so far.


  • Next Steps for The Native Paths

    So I have about a dozen left of the native paths to add to my database, in this first pass through Indian Paths of Pennsylvania (that book I’m following/analyzing/whatever). This is the pass where I go through the book from beginning to end, adding the basic info for each path to the database, adding the info about the start points and destinations, and generating the routes described in each chapter’s “For the Motorist” section.

    There are a few big pieces left to this project, which I think I can do all together in a second pass through the book:

    1. I need to document the relationships between the paths, as described for each path in the book (which is what required me to go through the book one first time: to get all the paths documented, before trying to map the relationships).
    2. I need to generate the actual footpath routes. This will probably be the most difficult and labor intensive task in the whole project, and I expect it will likely involve digitizing all the (low quality) maps in the book; it may also require trying to find primary sources, old deeds and land grants etc, and even after all that I expect I’ll have to live with a great deal of ambiguity in the routes.
    3. I’m not sure if I want to do this yet, but as I go through the book I may document any points of interest (landmarks, native towns that aren’t trail endpoints) that I haven’t already included.

    I’ve been thinking about the first part for a while, and have set up a separate bridge table in the database to capture these relationships; the table is set up with links to a subject path (the one that’s doing the referring) and an object path (the one getting referenced), and a link to another table with the list of possible relationships between them: intersections, alternate routes and spurs; aliases and alternate names; concurrencies (ie where the path shares some section of trail with another path); and the ever-popular “for more information see also.” I can add more relationships as I see the need.

    For the second task, I think I’ll want to use the maps in the book, even if it’s just to trace over. That means scanning the maps in some way without damaging the book (I may just photograph them with my phone), then georeferencing them and saving the result somewhere. I suspect I’ll end up with a pretty big set of raster data, and now need to consider how to do to organize it. Rasters are not something I have much experience with, so there will likely be a learning curve involved — I think I may put them in the database in some way.

    In terms of original research, my plan at the start was to use Indian Paths of Pennsylvania as my sole source — my project would be the book translated into GIS form — but I’ve already used other sources (e.g., Wikipedia, town websites) to flesh out histories and descriptions, and I think I’m seeing the book now as a condensation of other info, even if it’s just the author’s research files; the info in the book may have been “condensed,” oversimplified, to the point of vagueness, more exact versions of the trail descriptions exist somewhere. I really don’t want to get into actual archival research for this though, and it may just end up that if I dig really deep, I’ll only find that all the primary information is pretty vague too…

    Finally, that third task has me a bit stuck: I’d originally planned to only record the endpoints of the paths (as given in the book), and even called my points table “termini.” Now I’m looking to enter things like landmarks, known trail junctions — there are several places called “the parting of the ways” — towns that aren’t actually endpoints, and all sorts of other points of interest. I painted myself into a corner with that “termini” name, and even if it wouldn’t be too much of a stretch to stick these other points in the termini table, I may add a separate “points of interest” table, or at least add a column to the termini table to designate non-endpoints. (Maybe I’m overthinking this, I could easily find the endpoints and non-endpoints within a mixed table, just by using simple searches.)

    This kind of gets to what I want my native paths data to eventually look like. Many of these landmarks and points of interest are likely to be nodes in a trail network (just like the endpoints), so I am back to thinking they should all be part of the same table. I also expect that I’ll have trail segments from node to node, and my final paths will be lists of trail segments from start point to end point, so my final product will not look much like what I’m building now.

    Well, I still have some time to think about it.


  • Going Mobile

    I downloaded the route data for our upcoming trip from Adventure Cyclist as a GPX file, and I also got the Adventure Cycling route app and downloaded the trip there as well. The trip data consists of the route itself (as a path) and the locations (points) of recommended places for food, lodging, bike repairs, and so on; the data is the distillation of their collected wisdom and experience for any given ride. It’s been a goldmine of information for planning our trip, and knowing that it’s based on the knowledge and experience of other travelers makes me a bit more comfortable relying on it.

    The GPX is what I got first, and I plan to put the relevant parts of it on my Garmin for the trip, but I opened it in QGIS first because of course I did…

    There were six GPX files representing the bike routes as GPX tracks — the main route, a spur to Banff, and a gravel-bike alternate near Fernie, one file for each route in each direction — and one other file with all the services as GPX waypoints. The tracks didn’t contain much information, though the trackpoints themselves did have elevations; the meat of the data was in the service waypoints, and it was interesting to see what information Adventure Cyclist put in for each feature, and how they fit it within the confines of the GPX format.

    I don’t usually use GPX except for when I move things to and from my Garmin, so I don’t know too much about it but my impression is that it is highly structured, and, unless you use “extensions,” which not every application will honor or display, it’s a bit rigid in what it can hold — my data has almost always been square pegs, and GPX is all about round holes…

    What Adventure Cyclist did was to stuff a lot of the information into the “name” field using initials and abbreviations (“R, CS, M” for restaurant, convenience store and motel, for instance) along with the name, and put the telephone number (along with some travel directions; these were the only contact info given) into both the “comment” and the “description” fields, possibly because different GPS software would look at different fields.

    I took this data and massaged it for my own purposes. I also got the app and downloaded the route there. It had the same data, in a very readable and actually beautiful form; it also looked like they maybe used the same GPX data, maybe in another file format but the same structure, and massaged it on the fly. Very interesting…

    This got me thinking about my trail amenities map:

    • Do I have too much contact information, or not enough? (Answer: my contact information is just right.)
    • Am I presenting the information well, especially for use on a phone? (Answer: not really.)
    • How should I represent my amenities data, especially for places that have multiple amenities — hotel with restaurant, convenience store with bathroom? (Answer: this will require a whole lot of rework, but I think I should show multiple amenities as multiple symbols in a popup.)

    So I am now rethinking my own map based on what I liked about the Adventure Cycling map, but in the meantime I compromised and added some information-massage code of my own, to turn my phone information a clickable link: click on the number (on your phone) and your phone will make the call.

    It’s a start.