Listening: “Golden Brown” by the Stranglers
Well, so much for my previous experiment — don’t compartmentalize, just write — the real task is to actually take the time to write something. I haven’t been motivated lately to do any writing, but in my defense there have been a lot of things to write about, which might have caused a bit of vapor-lock. Among other things, I’ve still been volunteering at the Canal Museum and at CAT, we did another overnight trip up to Jim Thorpe, and I’ve been exploring mapping and routing again.
Listening: “Colossal” by Wolfmother
Listening: “Beautiful Red Dress” by Laurie Anderson
ON THE BIKE:
We did another trip up the towpath: Anne and me, Sarah A and Dianna H. We rode to Jim Thorpe, lunching in town and camping overnight at the lake. Breakfast in town, then Anne continued north on her own from there while Sarah and I did the return trip (Dianna met her husband in town and got a ride home). Anne’s destination was Watkins Glen, and I caught up with her by car there a few days later. I brought my road bike, but we didn’t do much cycling, just some hiking at the Glen, then a trip to the Museum of Glass in Corning on the way home.
Listening: “Help Me Mary” by Liz Phair
I kind of got the mountain biking itch again: I did a ride on some seriously “old school” trails, with Greg H up in the Poconos near his cabin, probably my favorite ride of the year so far (except for a persistent creaking out of my pivots). Got the pivots fixed, rode Nox on a weekday with Anne, and did Deer Path/Pine Tar in Jim Thorpe Sunday. I’ll be doing a towpath ride later today.
In between these things, I also took the Cycling Savvy course. Really fun, and though it covered a lot of the same ground as Road 1/LCI, I came away with more than a few choice new insights. I also rode across the Hill-to-Hill Bridge with my sister-in-law, which should have been a crazy idea, but by the time we did it (as part of the course), it was easy enough to be a bit anticlimactic.
Listening:“Drumming Song” by Florence + The Machine
We also managed to do some riding as part of Lehigh’s Car-free Day.
Listening: “Make You Mine” by Heather Nova
All this music just lets you know how slowly I write, and also how many in my “Favorites” playlist are female vocalists…
READING
I re-read The Mathematician’s Shiva recently, as well as all the “Expanse” books (which didn’t hold up to a re-read as well as I would have liked), and China Mieville’s Iron Council (ditto), the most recent new book was Walkable City by city planner and walkability expert/advocate Jeff Speck. Interestingly, he once was commissioned to do a study of Bethlehem, and gave a talk at Lehigh about his findings. (The town skipped over a bunch of his advice, but they did incorporate at least some of it, some parts more slowly than others.) It was fun (at first) to see him name-drop Bethlehem, and CAT, likely referring back to his study, but it became annoying after a while since it was mostly examples of what we were doing wrong…
Case in point: I had just finished the “Cycling Savvy” course when I got to Speck’s critique of “Vehicular Cycling,” where bicyclists are trained to bike (on the roads) as drivers of vehicles — in other words, “Road 1” and “Cycling Savvy.” His contention, and there is some merit to it, is that while this may help an individual graduate be safer, it makes cycling grim and scary, a turn-off, thus reducing the number of actual cyclists on the road — and since the biggest driver of cycling safety is not cyclist skill (or wearing a helmet or whatnot), but the number of cyclists on the road, the vehicular cycling approach actually reduces general cycling safety. Oh well, he has a point, but I still liked biking over that bridge.
Listening: “Old World” by The Modern Lovers
FUN WITH POSTGIS
I’ve been playing with a new project recently: building a web map for cycle commuters in the Valley. In the end it will show the major Lehigh Valley towns, and the locations of the major employers, and recommended routes that a cycle commuter might use to get around; I used Leaflet to get these basics down, but then I thought that what the map really needs is routing, and I thought it would be best to build a custom routing engine using PostGIS and pgRouting.
Listening: “Wildewoman” by Lucius
So, I’m back to my routing kick; this will be part 2 but I’ll be abandoning my previous project in favor of the web map.
Listening: “Twenty-first Century Schizoid Man” by King Crimson
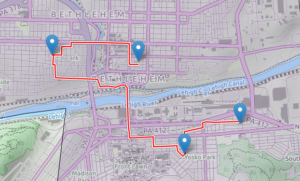
First step (of many) was to make sure I had pgRouting installed properly along with PostGIS, and they both were, no problem. Next up was to build my road network — for right now I’m working on a smaller area, a part of Bethlehem City. I got the road data from OpenStreetMap and used the osm2pgrouting utility to get the roads into the database. So far so good, and the whole process was surprisingly easy.
Using the routing functions took me a while to work out, but in the end they were also pretty straightforward. PostGIS/pgRouting seem to be easier to use, and easier to do sophisticated things with, than the original QGIS networking utilities.
Listening: “White Unicorn” by Wolfmother (oh no the same band again!)
Two things in particular came more easily: dealing with one-way streets, which I ignored in the first project since it seemed more trouble than it was worth (you could always walk your bike) and the actual “cost” of cycling.
The basic idea behind routing is to find a path through the network that minimizes some function, the total of the “costs” of moving from each individual point to point within the network. The default cost function for my first project was distance (the default, and by far the easiest thing to do), which is a pretty good cost function as far as it goes. But with bicycling, elevation changes could also play a major role, and with pgRouting it’s easy enough to define your own costs.
Listening: “Funkytown” by Lipps Inc.
So I decided to consider total ascent, every meter climbed, as part of the cost; I found some studies that cyclists generally take a meter of ascent as equivalent to eight meters of travel — that is, you might go eight meters longer to avoid another meter of climbing. I also thought that grade would affect that eight meters, and found another online study that multiplied ascent by a factor proportional to some power of grade. I eventually opted to go with a geometric factor, doubling elevation cost every 5% change in slope.
Listening: “Strangeness and Charm” by Florence + The Machine
I’ll get into it some other time, but I got QGIS to break up my network for finding ascent, and SAGA to assign elevations from DEM data, then wrote a Python script to extract and calculate the elevation costs. Took some doing, mostly dealing with my own typos, but finally I got the whole thing to work, and it routes beautifully — in QGIS, on my machine.
Listening: “There There” by Radiohead
I learned a few interesting things about elevation along the way. A sanity check of my cost results showed some anomalies, especially on 8th Avenue — it turns out my original “elevation data” was raw Space Shuttle radar data, and it picked up the top of the old Martin tower which screwed up nearby elevations. (This difference between ground elevation and radar/lidar elevation readings, the realm of buildings and trees, is — according to the Internet — very important to telecommunications people, who call it “clutter.”)
So for my second iteration I used actual DEM data (“digital elevation model,” the elevations at the surface of the Earth, as if it were scraped clear of buildings and vegetation), and that fixed the Martin Tower problem but revealed another one: bridges, my nemesis… I’ll have to figure out how to adjust elevations on bridges so they don’t follow the depressions (creeks, rivers) they jump over.
Listening: “Furr” by Blitzen Trapper
Well, that’s it for now…
“But I still dream of running careless through the snow,
And through the howling winds that blow
Across the ancient, distant flow
To fill our bodies up like water till we know.”
… now let’s ride!

